Reports
VLDS makes it possible to tap into and analyze data that has been up to now unavailable. It was either too time-consuming or too costly to capture, quantify and dissect or simply not permitted to use for cross-agency research. With VLDS, the Commonwealth now has visibility to the data to answer key important questions that will streamline operations and maximize program efficiency.
State Council of Higher Education (SCHEV)
Higher Education After High School
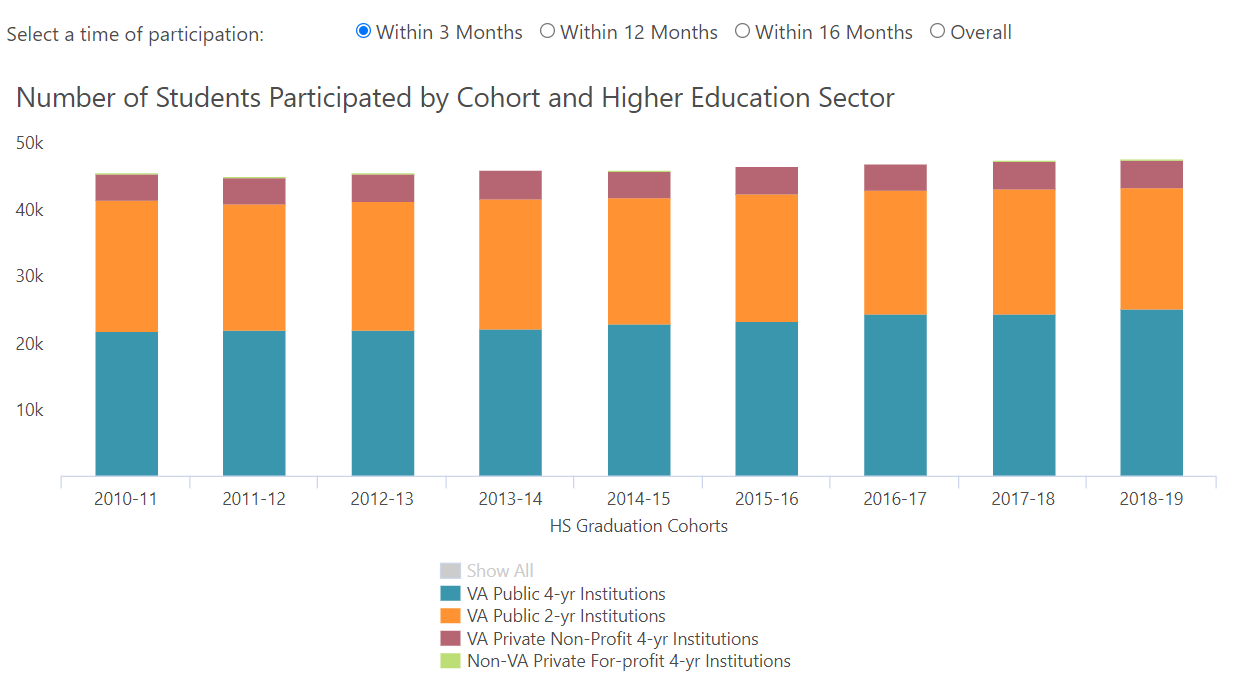
The Higher Education report analyzes the trend and demographics of Virginia high school students who participate in higher education.
State Council of Higher Education (SCHEV)
Record Level Agency Intersection Report
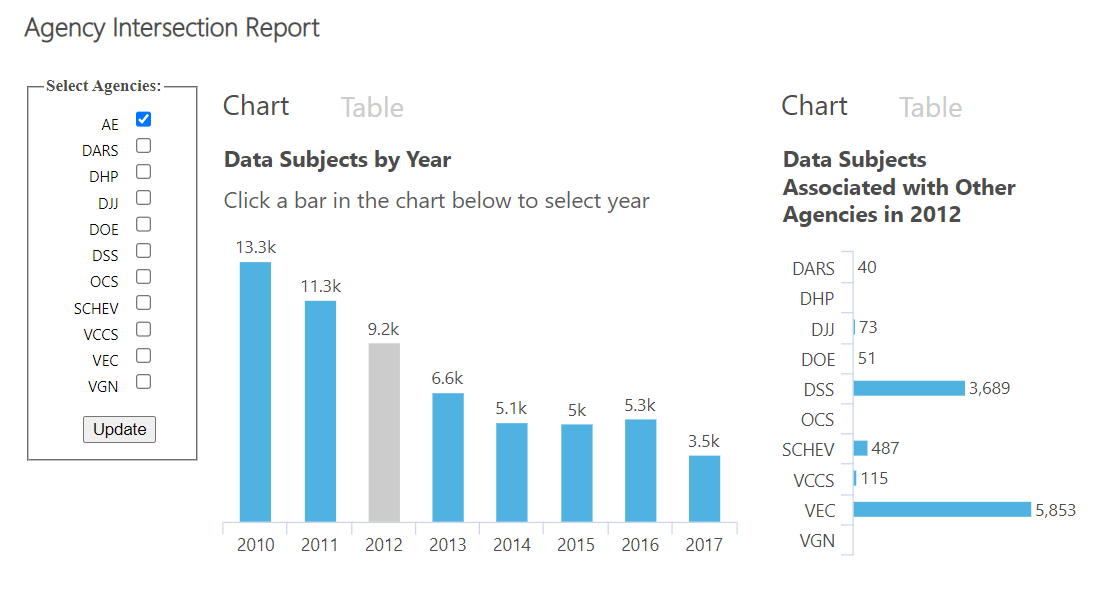
The Agency Intersection Report displays the count and agency connections between Virginia State agency populations given a data model that identifies probabilistic and deterministic record intersections.
State Council of Higher Education (SCHEV)
College Students on the Supplemental Nutrition Assistance Program (SNAP)
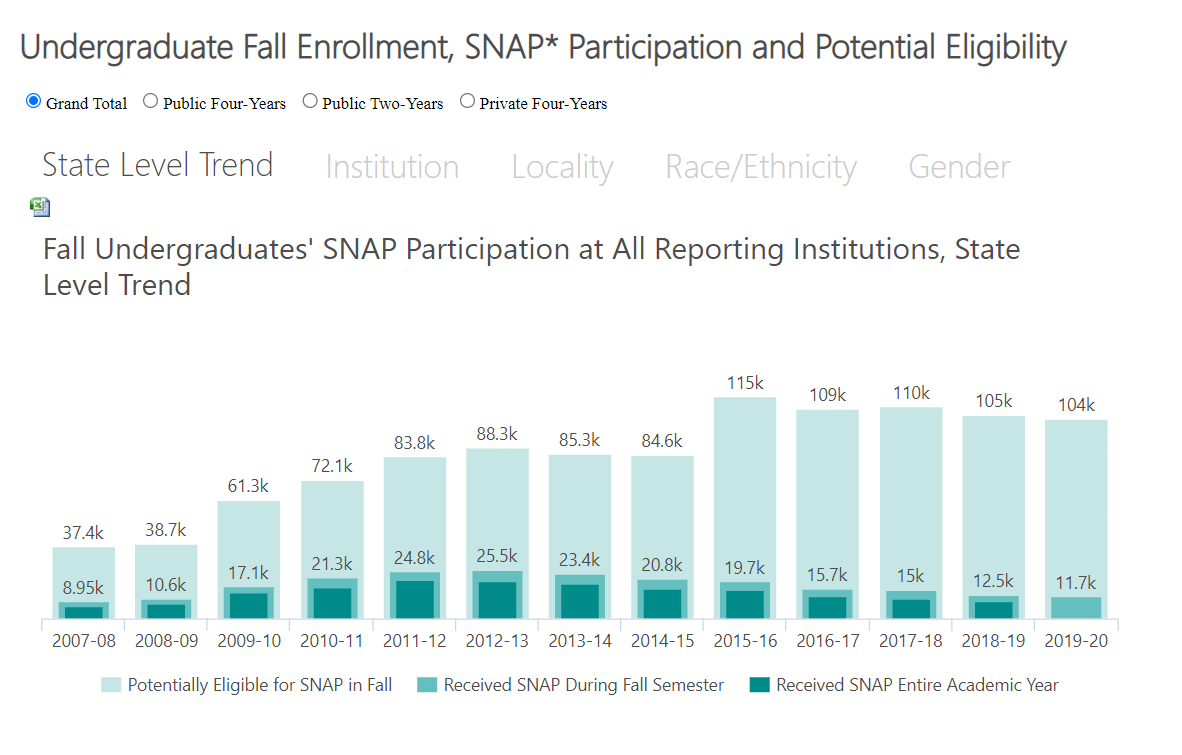
The SNAP report represents the trend and demographics of Virginia college students who participate in SNAP.
VLDS System
Agency Research Data Access and Usage Report
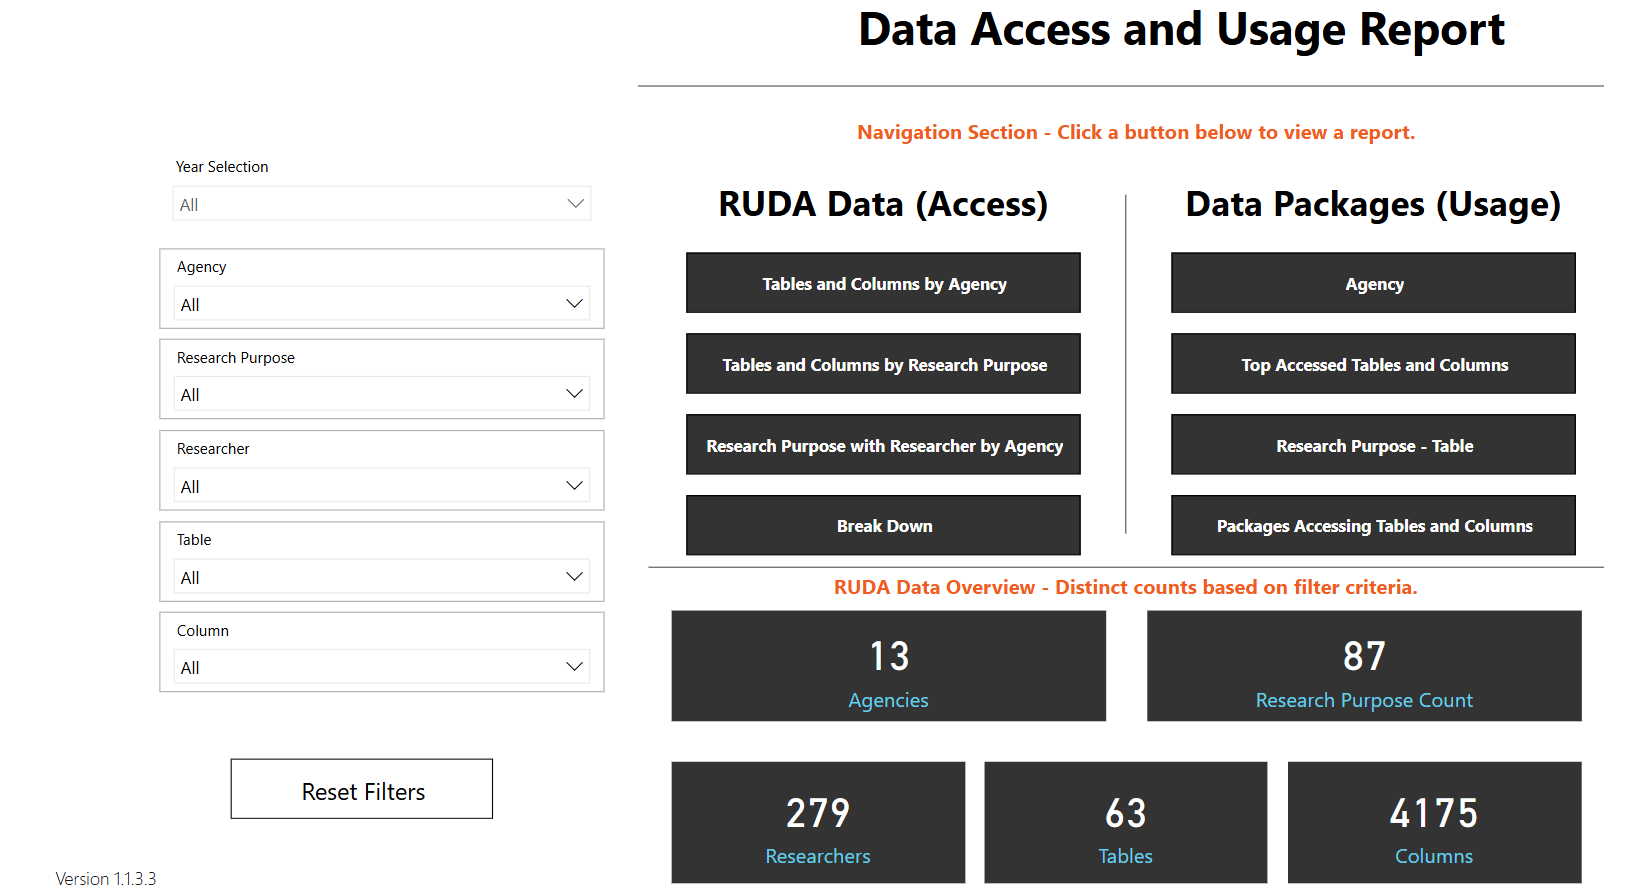
The Data Access and Usage Report provides analytics on the type of VLDS research data accessed and used by researchers.
Department of Health Professions (DHP)
Virginia's Behavioral Health Workforce
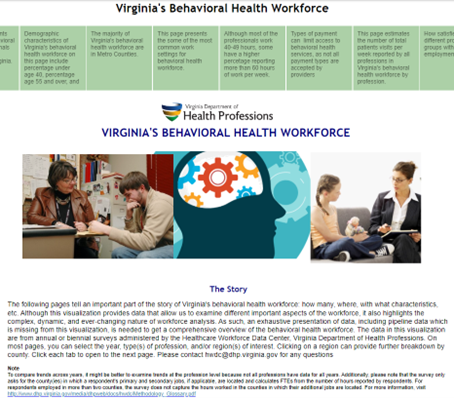
Did you know that 40% or less of licensed professional counselors, licensed clinical psychologists, and licensed clinical social workers accept Medicaid and/or Medicare for payment for behavioral healthcare services in Virginia? This compares to at least 70% of psychiatrists and nurse practitioners with a psychiatric/mental health specialty who do the same. These and other statistics are available from “Virginia's Behavioral Health Workforce,” a 16-paged visualization (viz) recently released by the Healthcare Workforce Data Center at the Virginia Department of Health Professions.
Department of Education (DOE)
Interactive Data Dashboards
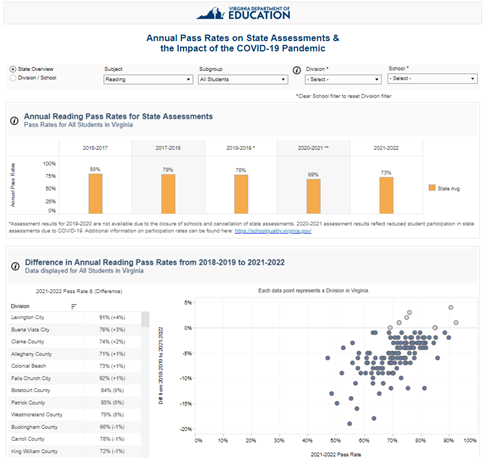
Here VDOE presents a collection of interactive and intuitive visual representations that aim to inform educators and the general public about important educational data. This growing library of visualizations provides a comprehensive overview of various educational metrics, allowing users to explore and gain valuable insights. These data visualizations offer an informative experience for educators seeking data-driven decision-making tools and the general public interested in understanding Virginia’s educational landscape.